





A glycemic index chart starts with legumes (soy 16, kidney beans 24, chickpeas 28, lentils 32), followed by barley, apple and pasta, while whole wheat bread (74) sits with white bread (75) among the high GIs. These values come from the 2008 international tables, compiled from 205 publications (Atkinson et al., 2008).
I am the son of a baker who was a Meilleur Ouvrier de France, raised on bread and milk. So the first time I went through the international glycemic index tables, one line stopped me cold: whole wheat bread 74, white bread 75. One point apart. Just one.
On 14 November 2026, it is the International Diabetes Federation's World Diabetes Day, and glycemic index charts will pop up everywhere again, in magazines as well as on social media. Many of these lists contradict each other. Where do their numbers come from? They rarely say. So I suggest we take the road in order: back to the source first, then on to the plate.
It is an old reflex of an ISTOM engineer: more than thirty years in organic food, Biovie founded in 2007, and always the same habit of reading the original publication before repeating a figure. A figure copied from list to list ends up like a game of telephone, where nobody knows in the end what was said at the start.
What does the glycemic index measure, and what does it leave out?
The principle comes down to one simple experiment. Volunteers eat a portion containing 50 g of available carbohydrates, their blood glucose is followed for 2 hours, and the area under the resulting curve is compared with the one produced by the same amount of glucose (Arvidsson-Lenner et al., 2004). The values in the 2008 tables come from groups of at least 8 healthy subjects (Atkinson et al., 2008). Nothing mysterious, then: repeated measurements, a curve, a comparison.
I like to picture a watering can. The glycemic index describes the flow from the spout, a trickle or a gush, but it says nothing about how much water is in the can, that is, what you actually put on your plate.
On the glucose scale, a GI is called low at 55 or less and high at 70 or more; in between, it is medium. The Nordic experts, who looked at the question closely, add that these table values are indicative and do not apply as such to a specific product. GI only makes sense for a food that provides at least 15 g, ideally 20 g, of available carbohydrates per portion, and it is compared within one group of foods.
Glycemic load (GL) puts the water back in the can: you multiply the GI by the grams of available carbohydrates in the portion, then divide by 100. Take cooked lentils, which the USDA composition table credits with 20.13 g of carbohydrates, including 7.90 g of fiber, per 100 g, so about 12.2 g of available carbohydrates. A 150 g portion (a generous ladleful, as a main dish) provides about 18.3 g, and with a GI of 32 the glycemic load comes to around 6.
That 6 comes from my own calculation and appears in no table, I prefer to say so, but it shows how the portion enters the reasoning. To go further on the composition of plant foods, see also my article on protein or carbohydrates in plant foods.
The glycemic index chart: low GI foods (and the high benchmarks)
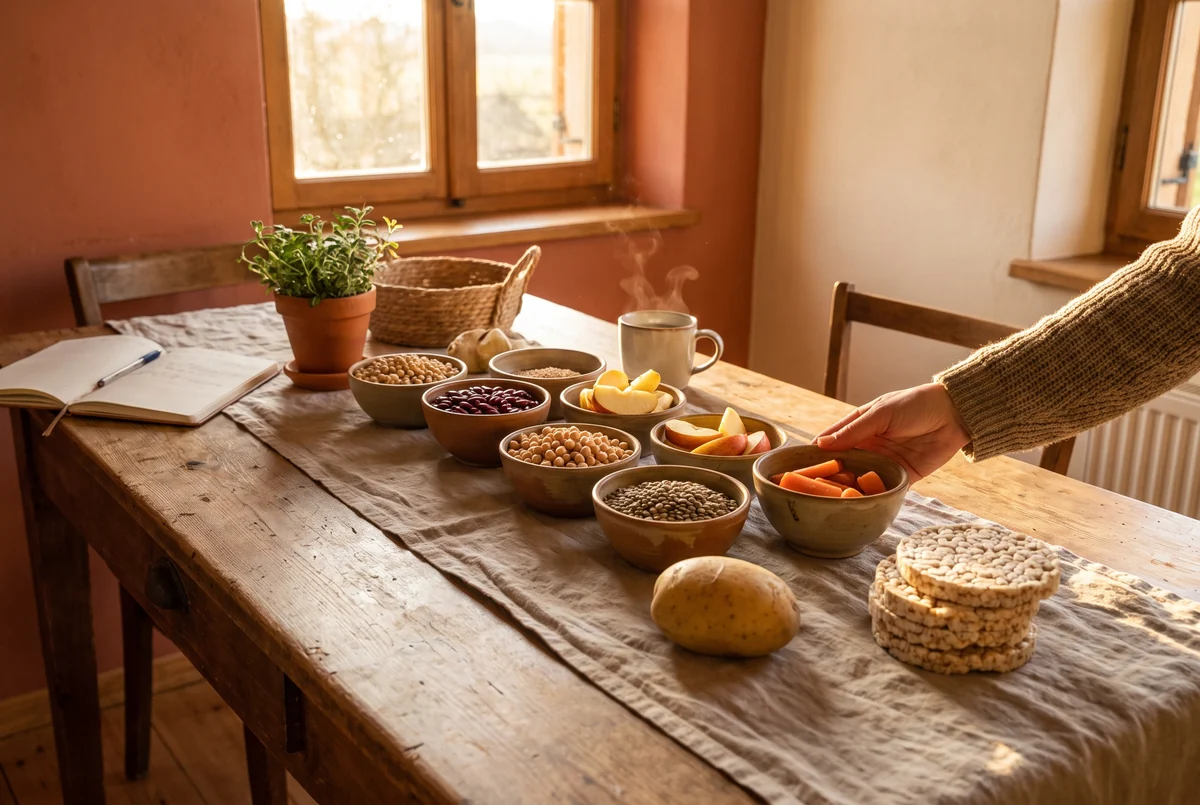
So here is the glycemic index food chart, low GI foods first, with the medium and high benchmarks, taken from the 2008 international tables: the reference table retains 62 common foods out of more than 2,480 measured in humans (Atkinson et al., 2008). The values are means on the glucose scale, followed by their standard error.
| Food | Mean GI ± standard error | Category |
|---|---|---|
| Soy | 16 ± 1 | Low GI |
| Kidney beans | 24 ± 4 | Low GI |
| Chickpeas | 28 ± 9 | Low GI |
| Barley | 28 ± 2 | Low GI |
| Lentils | 32 ± 5 | Low GI |
| Raw apple | 36 ± 2 | Low GI |
| Cooked carrots | 39 ± 4 | Low GI |
| Dates | 42 ± 4 | Low GI |
| Orange | 43 ± 3 | Low GI |
| Vegetable soup | 48 ± 5 | Low GI |
| Whole wheat spaghetti | 48 ± 5 | Low GI |
| White spaghetti | 49 ± 2 | Low GI |
| Banana | 51 ± 3 | Low GI |
| Chapati | 52 ± 4 | Low GI |
| Special grain bread | 53 ± 2 | Low GI |
| Muesli (recipe not specified) | 57 ± 2 | Medium GI |
| Cooked sweet potato | 63 ± 6 | Medium GI |
| Couscous (wheat semolina) | 65 ± 4 | Medium GI |
| Cooked brown rice | 68 ± 4 | Medium GI |
| Cooked white rice | 73 ± 4 | High GI |
| Whole wheat bread | 74 ± 2 | High GI |
| White bread | 75 ± 2 | High GI |
| Boiled potato | 78 ± 4 | High GI |
| Corn flakes (cornflakes) | 81 ± 6 | High GI |
| Instant mashed potato | 87 ± 3 | High GI |
| Puffed rice cakes | 87 ± 2 | High GI |
| Glucose (reference) | 103 ± 3 | High GI |
How can the same chickpea show two different scores from one glycemic index chart to the next? The small “±” precisely measures the spread between studies. The agronomist in me knows the phenomenon well: plant the same tomato variety on several plots, and the harvest will never weigh quite the same from one field to the next. Chickpeas 28 ± 9 means the measurements vary with the variety and the cooking.
Most legumes, pasta, fruit and dairy products remain classed as low GI in these tables. Now go down through the glycemic index chart foods in the high range: cornflakes (81) and puffed rice cakes (87) have in common that they are heavily processed, far from the grain as it comes out of the field. I cover this subject in my article on the bliss point of ultra-processed foods.
Should we ban boiled potatoes (78) then? Of course not, I have never believed in blacklists in cooking. A high GI does not make a food off-limits, since the portion and the rest of the meal count too.
Whole wheat bread and white bread: the surprise of the table
Whole wheat bread 74 ± 2, white bread 75 ± 2. For the baker's son that I am, it is the most telling line in the table, the one that shakes a deeply rooted idea: we often pick the whole wheat loaf thinking we have made the right choice for our blood glucose. A misconception, but a stubborn one. Having fiber does not guarantee a low GI. Conversely, barley (28) and special grain bread (53) stay in the low box, and I will be careful not to invent an explanation the table does not give: I was not in the laboratory, so I do not know exactly what those breads contained.
And rye bread, you may ask? Its glycemic index is often searched for, but it is not among the 62 foods of the reference table and its value depends on the recipe; whole wheat bread (74) and special grain bread (53) then serve as indicative benchmarks.
Dietary fiber: what is it for, and how much should you eat?
For EFSA, the European Food Safety Authority, dietary fiber covers non-digestible carbohydrates, plus lignin. Think of it as the framework of the plant: the part that our enzymes, those little workers of digestion, cannot cut up.
EFSA considered 25 g of fiber per day adequate for normal bowel transit in adults. For its part, Anses uses a benchmark of 30 g per day, and its INCA 3 survey, carried out among 5,855 people in 2014 and 2015, measured an average intake of 20 g in adults, judged too low (Anses, 2017). The numbers do not add up. And it is not for lack of available foods: if you are building a high fiber foods list, lentils, chickpeas and dried beans cost little and keep for a long time in the cupboard. Of course, the two agencies do not say quite the same thing, but the gap comes down to their criteria: EFSA based itself on transit, Anses set a higher overall benchmark, at a different date.
On the plate, 100 g of cooked lentils provide 7.9 g of fiber and 100 g of cooked chickpeas 7.6 g, according to the USDA. A 200 g plate of cooked lentils therefore covers about half of the 30 g benchmark (my calculation, based on the USDA and Anses). The 10 g that are missing each day fit in a plate of legumes only slightly more modest. No need to overhaul your cooking for that.
As part of a varied and balanced diet and a healthy lifestyle, adding legumes through the week remains one of the simplest ways to get closer to these benchmarks.
Legumes and satiety: what the trials say
In 2014, a meta-analysis pooled 9 controlled acute trials in humans (Li et al., 2014). An acute trial plays out over a few hours: a meal is served, then the participants' feeling of fullness is followed. It is a snapshot, not a film, and it teaches nothing about what happens over months.
After a meal with legumes, participants reported a feeling of fullness 31% higher than after a control meal with the same calorie content. In other words, at equal calories, the plate of legumes left them with a greater impression of having eaten well. One caveat though, and it matters. The amount eaten at the next meal did not change significantly, the sample sizes were small and the results varied from one trial to the next.
A modest result, then, but one that matches an idea I have carried with me for a long time: we are not here to fill a stomach, but to nourish an organism.
Lentils and chickpeas are not the only legumes worth exploring, by the way, and I gladly point you to lupin, a legume to rediscover. As part of a varied and balanced diet and a healthy lifestyle, their place on the plate is built meal after meal.
Building a fiber-rich plant-based plate
The basic move fits in one sentence: bring together in the same meal a legume (lentils, chickpeas, beans), a grain from the low box of the table such as barley or pasta, and vegetables. The GI of a complete meal is not that of a food eaten on its own, the Nordic experts remind us, since the tables measure foods eaten alone (Arvidsson-Lenner et al., 2004).
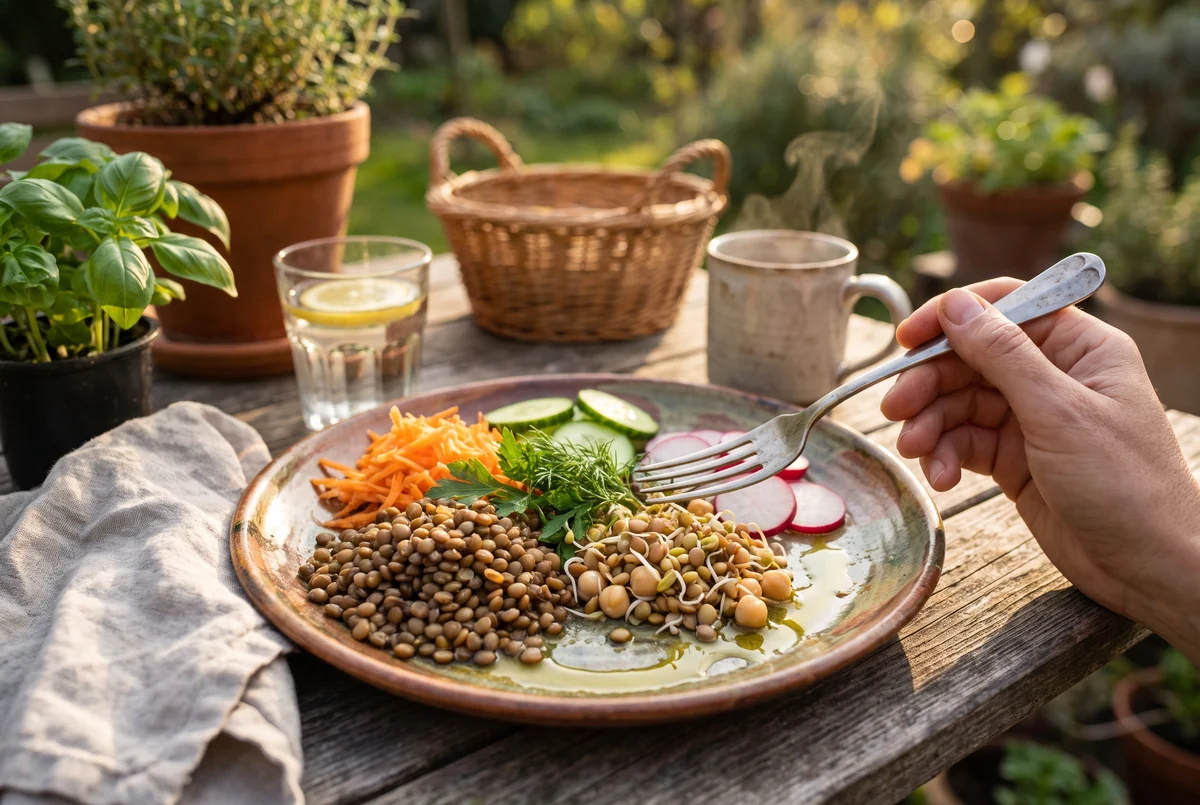
For a first step, there is something simpler than the saucepan: sprouting. I learned it out of necessity. As a student at ISTOM, I had no kitchen in my room, no right to use the shared kitchen, and no vegetarian option at the university canteen: I got into sprouted seeds in a big way to have something fresh. I had to be inventive! Proof that you can start with very little. Sprouted lentils or chickpeas can be added raw to a salad, with no cooking and just a jar, as long as you rinse them regularly for a few days. I talk about it in my article on sprouted seeds, sustainable and affordable foods.
If you eat little fiber today, increase it gradually and drink enough. This is practical advice, common sense more than a study result (none of those cited here quantifies it), to follow at your own pace.
Breakfast: an example with raw muesli
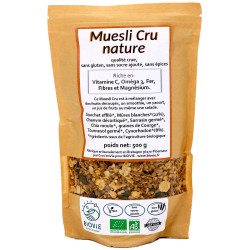
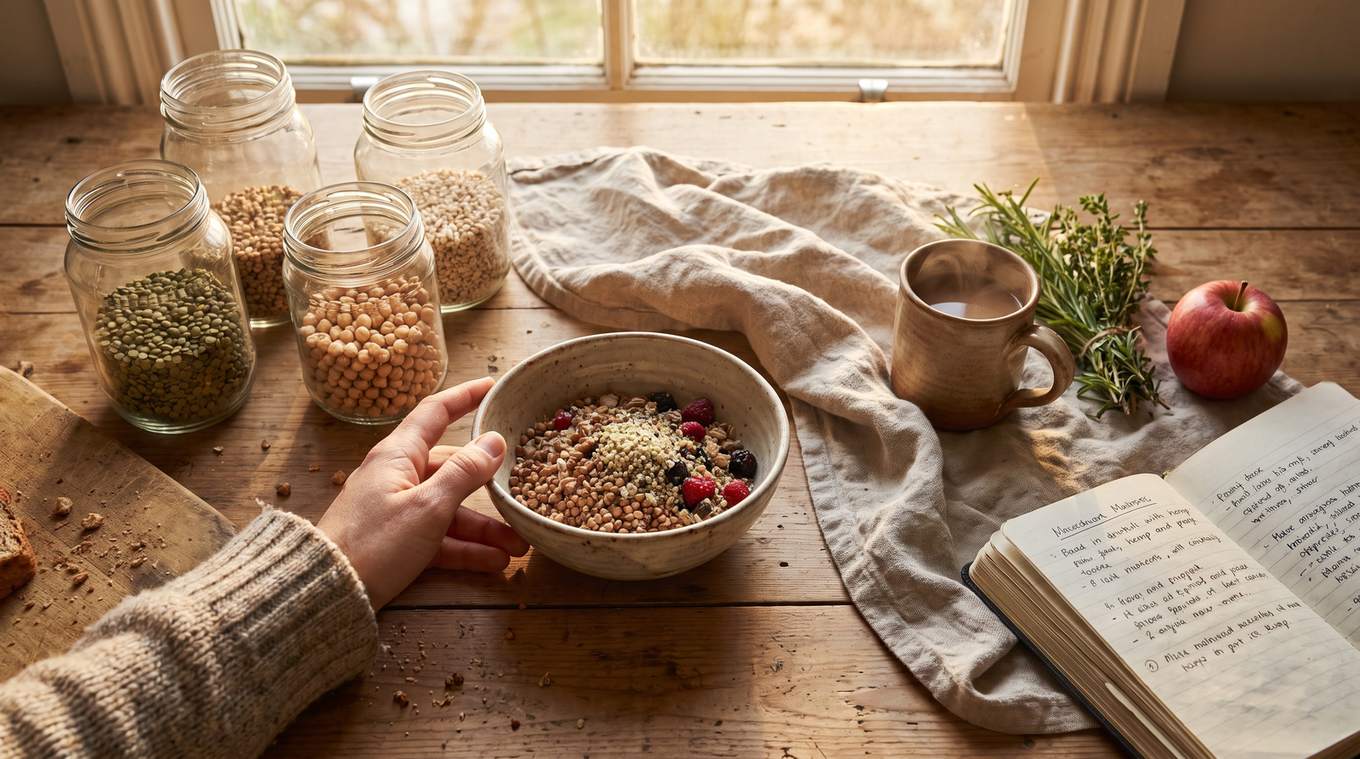
Breakfast lends itself well to the exercise: we repeat it every morning almost without thinking, so it is the right place to slip in a change that lasts. Our organic raw plain muesli combines buckwheat, hemp and tiger nut, with no oats and no cooking; at our place, buckwheat is also used for homemade crackers. I do not attribute to it the GI of 57 of the table's muesli, because the recipe measured is not specified and it is not ours.